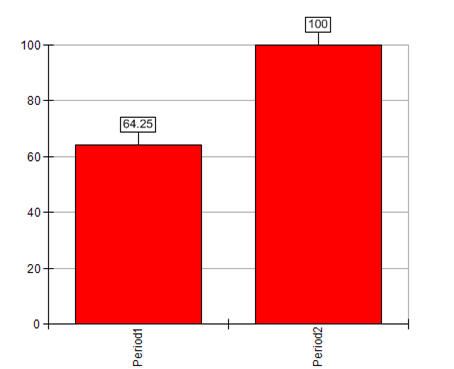
Efficiency Trend
This is a graphical representation of the efficiency trends between the periods where they exist. For example you can see the efficiencies in periods 1 and 2 in the illustration below. As above if you have specified subsets of DMUs either through selection lists or categorical variables you can also display trends for specific DMUs by selection or category of DMUs. You can specify the number of decimal places for the results under ‘precision’.